Financial Data Structures
When analyzing financial data, unstructured data sets, in this case tick data, are commonly transformed into a structured format referred to as bars, where a bar represents a row in a table. mlfinpy implements tick, volume, and dollar bars using traditional standard bar methods as well as the less common information driven bars.
Standard Bars
The four standard bar methods implemented share a similar underlying idea in that they take a sample of data after a certain threshold is reached and they all result in a time series of Open, High, Low, and Close data.
Time bars, are sampled after a fixed interval of time has passed.
Tick bars, are sampled after a fixed number of ticks have taken place.
Volume bars, are sampled after a fixed number of contracts (volume) has been traded.
Dollar bars, are sampled after a fixed monetary amount has been traded.
These bars are used throughout the text book (Advances in Financial Machine Learning, By Marcos Lopez de Prado, 2018, pg 25) to build the more interesting features for predicting financial time series data.
Tip
A fundamental paper that you need to read to have a better grasp on these concepts is: Easley, David, Marcos M. López de Prado, and Maureen O’Hara. “The volume clock: Insights into the high-frequency paradigm.” The Journal of Portfolio Management 39.1 (2012): 19-29.
Tip
A threshold can be either fixed (given as float) or dynamic (given as pd.Series). If a dynamic threshold is used
then there is no need to declare threshold for every observation. Values are needed only for the first observation
(or any time before it) and later at times when the threshold is changed to a new value.
Whenever sampling is made, the most recent threshold level is used.
An example for volume bars We have daily observations of prices and volumes:
Time |
Price |
Volume |
|---|---|---|
20.04.2020 |
1000 |
10 |
21.04.2020 |
990 |
10 |
22.04.2020 |
1000 |
20 |
23.04.2020 |
1100 |
10 |
24.04.2020 |
1000 |
10 |
And we set a dynamic threshold:
Time |
Threshold |
|---|---|
20.04.2020 |
20 |
23.04.2020 |
10 |
The data will be sampled as follows:
20.04.2020 and 21.04.2020 into one bar, as their volume is 20.
22.04.2020 as a single bar, as its volume is 20.
23.04.2020 as a single bar, as it now fills the lower volume threshold of 10.
24.04.2020 as a single bar again.
Time Bars
These are the traditional open, high, low, close bars that traders are used to seeing. The problem with using this sampling technique is that information doesn’t arrive to market in a chronological clock, i.e. news event don’t occur on the hour - every hour.
It is for this reason that Time Bars have poor statistical properties in comparison to the other sampling techniques.
- mlfinpy.data_structure.time_bars.get_time_bars(file_path_or_df: str | Iterable[str] | DataFrame, resolution: str = 'D', num_units: int = 1, batch_size: int = 20000000, verbose: bool = True, to_csv: bool = False, output_path: str | None = None)[source]
Create a DataFrame of time bars with columns: date_time, open, high, low, close, volume, cum_buy_volume, cum_ticks, cum_dollar_value.
Parameters
- file_path_or_dfstr or iterable of str or pd.DataFrame
Path to the csv file(s) or Pandas Data Frame containing raw tick data in the format[date_time, price, volume].
- resolutionstr
Resolution type (‘D’, ‘H’, ‘MIN’, ‘S’) is the resolution of the time bars in the format Day, Hour, Minute, or Second.
- num_unitsint
Number of days, minutes, etc.
- batch_sizeint
The number of rows per batch. Less RAM = smaller batch size.
- verbosebool
Print out batch numbers.
- to_csvbool
Save bars to csv after every batch run.
- output_pathstr
Path to csv file, if to_csv is True.
Returns
- pd.DataFrame
Dataframe of time bars.
Notes
Following the paper “The Volume Clock: Insights into the high frequency paradigm” by Lopez de Prado, et al, it is suggested that using 1/50 of the average daily dollar value, would result in more desirable statistical properties.
Example
from mlfinpy.data_structure import time_bars

# Time bars
time = time_bars.get_tick_bars('FILE_PATH', resolution = "MIN",
                                num_units = 1, batch_size=1000000,
                                verbose=False)
Tick Bars
- mlfinpy.data_structure.standard_bars.get_tick_bars(file_path_or_df: str | Iterable[str] | DataFrame, threshold: float = 70000000, batch_size: int = 20000000, verbose: bool = True, to_csv: bool = False, output_path: str | None = None)[source]
Create a DataFrame of tick bars with columns: date_time, open, high, low, close, volume, cum_buy_volume, cum_ticks, cum_dollar_value.
Parameters
- file_path_or_dfstr or iterable of str or pd.DataFrame
Path to the csv file(s) or Pandas Data Frame containing raw tick data in the format[date_time, price, volume]
- thresholdfloat
A cumulative number of ticks above this threshold triggers a sample to be taken.
- batch_sizeint
The number of rows per batch. Less RAM = smaller batch size.
- verbosebool
Print out batch numbers.
- to_csvbool
Save bars to csv after every batch run.
- output_pathstr
Path to csv file, if to_csv is True.
Returns
- pd.DataFrame
Dataframe of tick bars.
Notes
Following the paper “The Volume Clock: Insights into the high frequency paradigm” by Lopez de Prado, et al, it is suggested that using 1/50 of the average daily volume, would result in more desirable statistical properties.
Example
from mlfinpy.data_structure import standard_bars

# Tick Bars
tick = standard_bars.get_tick_bars('FILE_PATH', threshold=5500,
                                    batch_size=1000000, verbose=False)
Volume Bars
- mlfinpy.data_structure.standard_bars.get_volume_bars(file_path_or_df: str | Iterable[str] | DataFrame, threshold: float = 70000000, batch_size: int = 20000000, verbose: bool = True, to_csv: bool = False, output_path: str | None = None)[source]
Create a DataFrame of volume bars with columns: date_time, open, high, low, close, volume, cum_buy_volume, cum_ticks, cum_dollar_value.
Parameters
- file_path_or_dfstr or iterable of str or pd.DataFrame
Path to the csv file(s) or Pandas Data Frame containing raw tick data in the format[date_time, price, volume]
- thresholdfloat
A cumulative traded volume above this threshold triggers a sample to be taken.
- batch_sizeint
The number of rows per batch. Less RAM = smaller batch size.
- verbosebool
Print out batch numbers.
- to_csvbool
Save bars to csv after every batch run.
- output_pathstr
Path to csv file, if to_csv is True.
Returns
- pd.DataFrame
Dataframe of volume bars.
Notes
Following the paper “The Volume Clock: Insights into the high frequency paradigm” by Lopez de Prado, et al, it is suggested that using 1/50 of the average daily volume, would result in more desirable statistical properties.
Example
from mlfinpy.data_structure import standard_bars

# Volume Bars
volume = standard_bars.get_volume_bars('FILE_PATH', threshold=28000,
                                        batch_size=1000000, verbose=False)
Dollar Bars
Tip
Dollar bars are the most stable of the 4 types.
It is suggested that using 1/50 of the average daily dollar value, would result in more desirable statistical properties
- mlfinpy.data_structure.standard_bars.get_dollar_bars(file_path_or_df: str | Iterable[str] | DataFrame, threshold: float = 70000000, batch_size: int = 20000000, verbose: bool = True, to_csv: bool = False, output_path: str | None = None) DataFrame[source]
Creates a DataFrame of dollar bars with columns: date_time, open, high, low, close, volume, cum_buy_volume, cum_ticks, cum_dollar_value.
Parameters
- file_path_or_dfstr or iterable of str or pd.DataFrame
Path to the csv file(s) or Pandas Data Frame containing raw tick data in the format[date_time, price, volume].
- thresholdfloat
A cumulative traded dollar value above this threshold triggers a sample to be taken.
- batch_sizeint
The number of rows per batch. Less RAM = smaller batch size.
- verbosebool
Print out batch numbers.
- to_csvbool
Save bars to csv after every batch run.
- output_pathstr
Path to csv file, if to_csv is True.
Returns
- pd.DataFrame
Dataframe of dollar bars.
Notes
Following the paper “The Volume Clock: Insights into the high frequency paradigm” by Lopez de Prado, et al, it is suggested that using 1/50 of the average daily dollar value, would result in more desirable statistical properties.
Example
from mlfinpy.data_structure import standard_bars

# Dollar Bars
dollar = standard_bars.get_dollar_bars('FILE_PATH', threshold=70000000,
                                        batch_size=1000000, verbose=True)
Statistical Properties
The chart below that tick, volume, and dollar bars all exhibit a distribution significantly closer to normal - versus standard time bars:
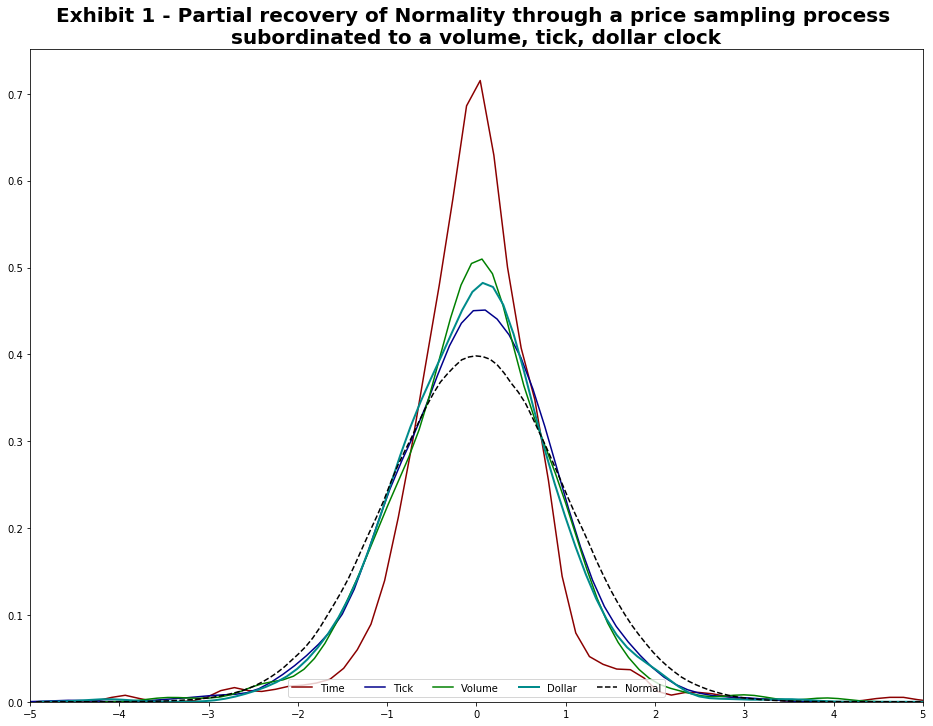
This matches up with the results of the original paper “The volume clock (2012)”.
Information-Driven Bars
Information-driven bars are based on the notion of sampling a bar when new information arrives to the market. The two types of information-driven bars implemented are imbalance bars and run bars. For each type, tick, volume, and dollar bars are included.
For those new to the topic, it is discussed in the graduate level textbook: Advances in Financial Machine Learning, Chapter 2.
Warning
This is a very advanced financial data structure with very little to no academic papers written about them. The idea has been introduced in the book but it requires a lot of experience to handle properly.
You should read the book Advances Machine Learning in Finance, plus that of microstructural features before committing to this data structure.
Imbalance Bars
2 types of imbalance bars are implemented in Mlfin.py:
Expected number of ticks, defined as EMA (book implementation)
Constant number of expected number of ticks.
Imbalance Bars Generation Algorithm
Let’s discuss the generation of imbalance bars on an example of volume imbalance bars. As it is described in Advances in Financial Machine Learning book:
First let’s define what is the tick rule:
For any given \(t\), where \(p_t\) is the price associated with \(t\) and \(v_t\) is volume, the tick rule \(b_t\) is defined as:
Tick rule is used as a proxy of trade direction, however, some data providers already provide customers with tick direction, in this case we don’t need to calculate tick rule, just use the provided tick direction instead.
Cumulative volume imbalance from \(1\) to \(T\) is defined as:
Where \(T\) is the time when the bar is sampled.
Next we need to define \(E_0[T]\) as the expected number of ticks, the book suggests to use a exponentially weighted moving average (EWMA) of the expected number of ticks from previously generated bars. Let’s introduce the first hyperparameter for imbalance bars generation: num_prev_bars which corresponds to the window used for EWMA calculation.
Here we face the problem of the first bar’s generation, because we don’t know the expected number of ticks upfront. To solve this we introduce the second hyperparameter: expected_num_ticks_init which corresponds to initial guess for expected number of ticks before the first imbalance bar is generated.
Bar is sampled when:
To estimate (expected imbalance) we simply calculate the EWMA of volume imbalance from previous bars, that is why we need to store volume imbalances in an imbalance array, the window for estimation is either expected_num_ticks_init before the first bar is sampled, or expected number of ticks(\(E_0[T]\)) * num_prev_bars when the first bar is generated.
Note that when we have at least one imbalance bar generated we update \(2v^+ - E_0[v_t]\) only when the next bar is sampled and not on every trade observed
Algorithm Logic
Now that we have understood the logic of the imbalance bar generation, let’s understand the process in further detail.
# Pseudo code
num_prev_bars = 3
expected_num_ticks_init = 100000
expected_num_ticks = expected_num_ticks_init
cum_theta = 0
num_ticks = 0
imbalance_array = []
imbalance_bars = []
bar_length_array = []

for row in data.rows:
   # Track high, low,c lose, volume info
   num_ticks += 1
   tick_rule = get_tick_rule(price, prev_price)
   volume_imbalance = tick_rule * row['volume']
   imbalance_array.append(volume_imbalance)
   cum_theta += volume_imbalance
   if len(imbalance_bars) == 0 and len(imbalance_array) >= expected_num_ticks_init:
   expected_imbalance = ewma(imbalance_array, window=expected_num_ticks_init)

   if abs(cum_theta) >= expected_num_ticks * abs(expected_imbalance):
   bar = form_bar(open, high, low, close, volume)
   imbalance_bars.append(bar)
   bar_length_array.append(num_ticks)
   cum_theta, num_ticks = 0, 0
   expected_num_ticks = ewma(bar_lenght_array, window=num_prev_bars)
   expected_imbalance = ewma(imbalance_array, window = num_prev_bars*expected_num_ticks)
Note that in algorithm pseudo-code we reset \(\theta_t\) when bar is formed, in our case the formula for \(\theta_t\) is:
Let’s look at dynamics of \(|\theta_t|\) and \(E_0[T] * |2v^+ - E_0[v_t]|\) to understand why we decided to reset \(\theta_t\) when a bar is formed. The following figure highlights the dynamics when theta value is reset:
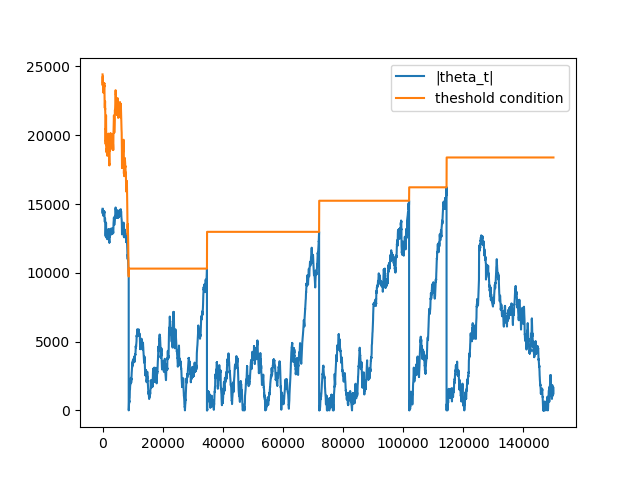
Note that on the first set of ticks, the threshold condition is not stable. Remember, before the first bar is generated, the expected imbalance is calculated on every tick with window = expected_num_ticks_init, that is why it changes with every tick. After the first bar was generated both expected number of ticks (\(E_0[T]\)) and expected volume imbalance (\(2v^+ - E_0[v_t]\)) are updated only when the next bar is generated
When theta is not reset:
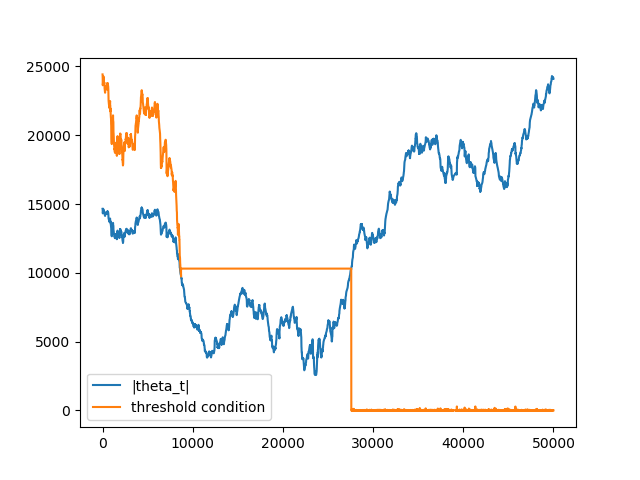
The reason for that is due to the fact that theta is accumulated when several bars are generated theta value is not reset \(\Rightarrow\) condition is met on small number of ticks \(\Rightarrow\) length of the next bar converges to 1 \(\Rightarrow\) bar is sampled on the next consecutive tick.
The logic described above is implemented in the Mlfin.py package under ImbalanceBars
Implementation
There are 2 different implementations which have been discussed in the previous section.
EMA Version
Tick Bars
- mlfinpy.data_structure.imbalance_bars.get_ema_tick_imbalance_bars(file_path_or_df: str | Iterable[str] | DataFrame, num_prev_bars: int = 3, expected_imbalance_window: int = 10000, exp_num_ticks_init: int = 20000, exp_num_ticks_constraints: List[float] | None = None, batch_size: int = 20000000.0, analyse_thresholds: bool = False, verbose: bool = True, to_csv: bool = False, output_path: str | None = None) Tuple[DataFrame, DataFrame][source]
Creates a DataFrame of EMA tick imbalance bars with columns: date_time, open, high, low, close, volume, cum_buy_volume, cum_ticks, cum_dollar_value.
Parameters
- file_path_or_dfstr, iterable of str, or pd.DataFrame
Path to the csv file(s) or Pandas Data Frame containing raw tick data in the format[date_time, price, volume].
- num_prev_barsint, optional (default=3)
Window size for E[T]s (number of previous bars to use for expected number of ticks estimation).
- expected_imbalance_windowint, optional (default=10000)
EMA window used to estimate expected imbalance.
- exp_num_ticks_initint, optional (default=20000)
Initial expected number of ticks per bar.
- exp_num_ticks_constraintslist or None, optional (default=None)
Minimum and maximum possible number of expected ticks. Used to control bars sampling convergence.
- batch_sizeint, optional (default=2e7)
The number of rows per batch. Less RAM = smaller batch size.
- verbosebool, optional (default=True)
Print out batch numbers (True or False).
- to_csvbool, optional (default=False)
Save bars to csv after every batch run (True or False).
- analyse_thresholdsbool, optional (default=False)
Flag to save and return thresholds used to sample imbalance bars.
- output_pathstr or None, optional (default=None)
Path to csv file, if to_csv is True.
Returns
- imbalance_barspd.DataFrame
DataFrame of tick imbalance bars.
- thresholdspd.DataFrame
DataFrame of thresholds, if to_csv=True returns None.
Volume Bars
- mlfinpy.data_structure.imbalance_bars.get_ema_volume_imbalance_bars(file_path_or_df: str | Iterable[str] | DataFrame, num_prev_bars: int = 3, expected_imbalance_window: int = 10000, exp_num_ticks_init: int = 20000, exp_num_ticks_constraints: List[float] | None = None, batch_size: int = 20000000.0, analyse_thresholds: bool = False, verbose: bool = True, to_csv: bool = False, output_path: str | None = None) Tuple[DataFrame, DataFrame][source]
Creates a DataFrame of EMA volume imbalance bars with columns: date_time, open, high, low, close, volume, cum_buy_volume, cum_ticks, cum_dollar_value.
Parameters
- file_path_or_dfstr, iterable of str, or pd.DataFrame
Path to the csv file(s) or Pandas Data Frame containing raw tick data in the format[date_time, price, volume].
- num_prev_barsint, optional (default=3)
Window size for E[T]s (number of previous bars to use for expected number of ticks estimation).
- expected_imbalance_windowint, optional (default=10000)
EMA window used to estimate expected imbalance.
- exp_num_ticks_initint, optional (default=20000)
Initial expected number of ticks per bar.
- exp_num_ticks_constraintslist or None, optional (default=None)
Minimum and maximum possible number of expected ticks. Used to control bars sampling convergence.
- batch_sizeint, optional (default=2e7)
The number of rows per batch. Less RAM = smaller batch size.
- verbosebool, optional (default=True)
Print out batch numbers (True or False).
- to_csvbool, optional (default=False)
Save bars to csv after every batch run (True or False).
- analyse_thresholdsbool, optional (default=False)
Flag to save and return thresholds used to sample imbalance bars.
- output_pathstr or None, optional (default=None)
Path to csv file, if to_csv is True.
Returns
- imbalance_barspd.DataFrame
DataFrame of volume imbalance bars.
- thresholdspd.DataFrame
DataFrame of thresholds, if to_csv=True returns None.
Dollar Bars
- mlfinpy.data_structure.imbalance_bars.get_ema_dollar_imbalance_bars(file_path_or_df: str | Iterable[str] | DataFrame, num_prev_bars: int = 3, expected_imbalance_window: int = 10000, exp_num_ticks_init: int = 20000, exp_num_ticks_constraints: List[float] | None = None, batch_size: int = 20000000.0, analyse_thresholds: bool = False, verbose: bool = True, to_csv: bool = False, output_path: str | None = None) Tuple[DataFrame, DataFrame][source]
Creates a DataFrame of EMA dollar imbalance bars with columns: date_time, open, high, low, close, volume, cum_buy_volume, cum_ticks, cum_dollar_value.
Parameters
- file_path_or_dfstr or iterable of str or pd.DataFrame
Path to the csv file(s) or Pandas Data Frame containing raw tick data in the format[date_time, price, volume].
- num_prev_barsint, optional (default=3)
Window size for E[T]s (number of previous bars to use for expected number of ticks estimation).
- expected_imbalance_windowint, optional (default=10000)
EMA window used to estimate expected imbalance.
- exp_num_ticks_initint, optional (default=20000)
Initial expected number of ticks per bar.
- exp_num_ticks_constraintslist or None, optional (default=None)
Minimum and maximum possible number of expected ticks. Used to control bars sampling convergence.
- batch_sizeint, optional (default=2e7)
The number of rows per batch. Less RAM = smaller batch size.
- verbosebool, optional (default=True)
Print out batch numbers (True or False).
- to_csvbool, optional (default=False)
Save bars to csv after every batch run (True or False).
- output_pathstr or None, optional (default=None)
Path to csv file, if to_csv is True.
- analyse_thresholdsbool, optional (default=False)
Flag to save and return thresholds used to sample imbalance bars.
Returns
- imbalance_barspd.DataFrame
DataFrame of dollar imbalance bars.
- thresholdspd.DataFrame
DataFrame of thresholds, if to_csv=True returns None.
Constant Version
Tick Bars
- mlfinpy.data_structure.imbalance_bars.get_const_dollar_imbalance_bars(file_path_or_df: str | Iterable[str] | DataFrame, expected_imbalance_window: int = 10000, exp_num_ticks_init: int = 20000, batch_size: int = 20000000.0, analyse_thresholds: bool = False, verbose: bool = True, to_csv: bool = False, output_path: str | None = None) Tuple[DataFrame, DataFrame][source]
Creates a DataFrame of Const dollar imbalance bars with columns: date_time, open, high, low, close, volume, cum_buy_volume, cum_ticks, cum_dollar_value.
Parameters
- file_path_or_dfstr, iterable of str, or pd.DataFrame
Path to the csv file(s) or Pandas Data Frame containing raw tick data in the format[date_time, price, volume].
- expected_imbalance_windowint, optional (default=10000)
EMA window used to estimate expected imbalance.
- exp_num_ticks_initint, optional (default=20000)
Initial expected number of ticks per bar.
- batch_sizeint, optional (default=2e7)
The number of rows per batch. Less RAM = smaller batch size.
- verbosebool, optional (default=True)
Print out batch numbers (True or False).
- to_csvbool, optional (default=False)
Save bars to csv after every batch run (True or False).
- analyse_thresholdsbool, optional (default=False)
Flag to save and return thresholds used to sample imbalance bars.
- output_pathstr or None, optional (default=None)
Path to csv file, if to_csv is True.
Returns
- imbalance_barspd.DataFrame
DataFrame of dollar imbalance bars.
- thresholdspd.DataFrame
DataFrame of thresholds, if to_csv=True returns None.
Volume Bars
- mlfinpy.data_structure.imbalance_bars.get_const_volume_imbalance_bars(file_path_or_df: str | Iterable[str] | DataFrame, expected_imbalance_window: int = 10000, exp_num_ticks_init: int = 20000, batch_size: int = 20000000.0, analyse_thresholds: bool = False, verbose: bool = True, to_csv: bool = False, output_path: str | None = None) Tuple[DataFrame, DataFrame][source]
Creates a DataFrame of Const volume imbalance bars with columns: date_time, open, high, low, close, volume, cum_buy_volume, cum_ticks, cum_dollar_value.
Parameters
- file_path_or_dfstr, iterable of str, or pd.DataFrame
Path to the csv file(s) or Pandas Data Frame containing raw tick data in the format[date_time, price, volume].
- expected_imbalance_windowint, optional (default=10000)
EMA window used to estimate expected imbalance.
- exp_num_ticks_initint, optional (default=20000)
Initial expected number of ticks per bar.
- batch_sizeint, optional (default=2e7)
The number of rows per batch. Less RAM = smaller batch size.
- verbosebool, optional (default=True)
Print out batch numbers (True or False).
- to_csvbool, optional (default=False)
Save bars to csv after every batch run (True or False).
- analyse_thresholdsbool, optional (default=False)
Flag to save and return thresholds used to sample imbalance bars.
- output_pathstr or None, optional (default=None)
Path to csv file, if to_csv is True.
Returns
- imbalance_barspd.DataFrame
DataFrame of volume imbalance bars.
- thresholdspd.DataFrame
DataFrame of thresholds, if to_csv=True returns None.
Dollar Bars
- mlfinpy.data_structure.imbalance_bars.get_const_tick_imbalance_bars(file_path_or_df: str | Iterable[str] | DataFrame, expected_imbalance_window: int = 10000, exp_num_ticks_init: int = 20000, batch_size: int = 20000000.0, analyse_thresholds: bool = False, verbose: bool = True, to_csv: bool = False, output_path: str | None = None) Tuple[DataFrame, DataFrame][source]
Creates a DataFrame of Const tick imbalance bars with columns: date_time, open, high, low, close, volume, cum_buy_volume, cum_ticks, cum_dollar_value.
Parameters
- file_path_or_dfstr or pd.DataFrame
Path to the csv file or Pandas Data Frame containing raw tick data in the format[date_time, price, volume].
- expected_imbalance_windowint, optional (default=10000)
EMA window used to estimate expected imbalance.
- exp_num_ticks_initint, optional (default=20000)
Initial expected number of ticks per bar.
- batch_sizeint, optional (default=2e7)
The number of rows per batch. Less RAM = smaller batch size.
- analyse_thresholdsbool, optional (default=False)
Flag to save and return thresholds used to sample imbalance bars.
- verbosebool, optional (default=True)
Print out batch numbers (True or False).
- to_csvbool, optional (default=False)
Save bars to csv after every batch run (True or False).
- output_pathstr or None, optional (default=None)
Path to csv file, if to_csv is True.
Returns
- imbalance_barspd.DataFrame
DataFrame of tick imbalance bars.
- thresholdspd.DataFrame
DataFrame of thresholds, if to_csv=True returns None.
Example
from mlfinpy.data_structure import get_ema_dollar_imbalance_bars, get_const_dollar_imbalance_bars

# EMA, Const Dollar Imbalance Bars
dollar_imbalance_ema = get_ema_dollar_imbalance_bars('FILE_PATH', num_prev_bars=3, exp_num_ticks_init=100000,
                                                     exp_num_ticks_constraints=[100, 1000], expected_imbalance_window=10000)

dollar_imbalance_const = get_const_dollar_imbalance_bars('FILE_PATH', exp_num_ticks_init=100000, expected_imbalance_window=10000)